THE INFLUENCE OF SELECTED SOCIO-DEMOGRAPHIC VARIABLES ON THE DIFFERENCES IN THE QUALITY OF EXPECTED AND PERCEIVED ATTRIBUTES OF SPA SERVICES IN CENTRAL AND SOUTHEASTERN EUROPE

Abstract
The paper examined the influence of selected socio-demographic variables on differences between expected and perceived quality attributes of spa services. The study included 700 respondents from seven countries of Central and Southeastern Europe: Slovakia, Slovenia, Croatia, Bosnia and Herzegovina, Montenegro, North Macedonia, and Serbia. The assessment of spa service quality was conducted by measuring the discrepancy between expected and perceived attributes using the SERVQUAL model, which includes five dimensions: tangibility, reliability, responsiveness, assurance, and empathy. The discrepancy, defined through the Gap model, is expressed as the difference between expected and perceived service attributes. Statistical testing confirmed significant differences between expected and perceived attributes across all dimensions, except for empathy, where no statistically significant difference was identified.
Article
Introduction
Travel, as an expression of different human needs and motives, has existed since the early stages of human society. The main motives for travel have changed over time in line with socio-economic developments and historical periods. Common motives include rest and relaxation, escape from everyday routines, health and wellness, fitness and sports, adventure, religious purposes, cultural interests such as art and sightseeing, social interaction, participation in seminars and conferences, business activities, visiting friends and relatives, and shopping (Premović, 2021).
The growth of wellness and spa tourism is closely linked to increasing health awareness and changes in lifestyle patterns (Papadopoulou, 2020; Badulescu et al., 2024). In current socio-economic conditions, the need for rest and relaxation has become an important travel motive, which contributes to the expansion of wellness and spa tourism. Europe has a leading position in the development of this sector. The spa industry continues to grow at the global level, supported by rising awareness of health and the expansion of wellness-oriented travel (Sangpikul, 2023).
Changes in lifestyle and work patterns have contributed to greater interest in wellness and spa tourism. Increased attention to personal health, as well as environmental awareness, also supports the development of this form of tourism.
Literature review
Tourism includes specific sub-sectors that differ from the mainstream and address not only well-being but also other needs. One such sub-sector is spa tourism, which combines well-being and health (Kantorová et al., 2023). As societies adopt more health-conscious lifestyles, the spa and wellness sector shows notable changes in consumer behavior, reflecting growth in health tourism. According to Qu (2025), spa tourism also supports cultural exchange and preserves local traditions through the inclusion of local communities in tourism activities, which contributes to visitors’ cultural experiences. Papadopoulou (2020) points out that spa tourism represents a collection of water-based and non-water facilities used to provide a wide range of health, medical, relaxation, and beauty treatments. Although definitions of spa tourism differ slightly, there is general agreement that it combines elements of health, wellness, and experiential tourism. Some authors equate spa tourism with health resorts. According to the Act of 28 July 2005 on spa treatment, spas and areas of spa protection are defined as separate areas where spa treatment takes place with the aim of using and preserving natural medicinal resources (Dąbrowski et al., 2021). The literature also identifies two main segments of spa tourists based on the primary benefit sought: wellness spa tourists and healthcare or medical spa tourists. Spa facilities meet the needs of both groups (Pelegrín-Borondo et al., 2020). Kantorová et al. (2023) describe a spa as a place where therapeutic services are provided for disease prevention, treatment, recovery of strength, and general well-being. It includes a set of therapeutic and relaxation activities, supported by the architecture of spa complexes, the surrounding environment, and historical and social elements. According to the International Spa Association (ISPA), spas provide professional services that improve well-being through care of the body, mind, and spirit (Hashemi et al., 2015; Papadopoulou, 2020). Spa and wellness therapies include a range of treatments that contribute to physical and mental comfort. Papadopoulou (2020) states that individuals engage in spa tourism to restore health across psychological, physiological, and social dimensions. Spa tourism also provides opportunities for rest and leisure outside daily routines. Due to these characteristics, spa tourism represents a growing segment of the tourism economy, with increased interest in both traditional therapeutic practices and newer approaches (Badulescu et al., 2024). Europe has a leading position in this field. Major source countries include Russia, Greece, Germany, and the United Kingdom, while Russia stands out as a significant market in health and wellness tourism (Bacsi et al., 2024). Spa tourism includes a wide range of services. Water-based therapies include hydrotherapy, thalassotherapy, balneotherapy, and cosmetic treatments. Complementary therapies include massage, peloid therapy, climatotherapy, sound therapy, mud treatments, color therapy, heliotherapy, and physical exercise (Qu, 2025).
Constant changes across all areas of human activity represent a key characteristic of modern society and the knowledge-based economy. These changes are particularly evident in tourism, where tourists show increasing demands regarding the quality of products and services. To meet the demand for high-quality and complex tourism offerings, the spa tourism sector must adapt to changing conditions and evolving tourist preferences. This adaptation includes the integration of wellness and medical services in order to ensure customer satisfaction and long-term growth. For managers and policymakers in spa tourism, it is important to understand the main reasons why individuals use spa services, as well as their expectations and lifestyle patterns. Loureiro et al. (2013) state that relaxation represents the primary emotion in the spa context and contributes more to customer satisfaction than pleasure, while it has limited influence on word-of-mouth communication. Pelegrín-Borondo, Araújo-Vila, and Fraiz-Brea conducted research in Spain in 2020 and found that performance expectancy had the strongest influence, while differences between wellness and medical tourists were observed only in relation to the pleasure variable (Badulescu et al., 2024).
Suban (2025) reports that customers prefer branded spa products, a wide range of facilities, a high level of privacy, moderate pricing, and highly qualified therapists. These factors are identified as the most important when making spa reservations. Sasser et al. (1978) argue that customer expectations are reflected in specific service attributes. In contrast, Grönroos (1984) states that service quality is assessed through a comparison between expected and perceived service.
The evaluation of service quality often relies on two widely used measurement scales: SERVQUAL and SERVPERF. SERVQUAL is based on the comparison between customer expectations and actual service performance, while SERVPERF focuses only on perceived service quality (Quester et al., 2015). The SERVQUAL approach is grounded in the GAP model, which examines the difference between expectations and perceptions of service delivery (Pavlović et al., 2018). Parasuraman et al. (1991) note that some authors question the measurement of expectations due to theoretical and practical limitations, while others consider the comparison between expectations and perceptions as a reliable approach to quality assessment. Alén (2020) compared measurement scales in thermal facilities and found that SERVPERF shows better psychometric characteristics than models based on the expectation–perception approach.
Despite the growing volume of research on spa tourism, comparative studies that examine both expected and perceived service quality across several countries remain limited. This study addresses this gap through a cross-country analysis in Central and Southeastern Europe.
Materials and methods
Taking these aspects into account, the authors examined the influence of selected socio-demographic variables on differences between expected and perceived quality attributes of spa services. An original empirical study was conducted with a sample of 700 respondents from seven countries in Central and Southeastern Europe. The research was designed as a quantitative cross-sectional study based on primary data collected through a structured questionnaire. The aim was to identify differences between expected and perceived service quality attributes and to determine whether these differences vary across selected socio-demographic characteristics. Data were collected from respondents in Serbia, Croatia, Bosnia and Herzegovina, Montenegro, North Macedonia, Slovenia, and Slovakia.
Due to the international and comparative nature of the study, a non-probability sampling method was applied. A convenience sample was used, consisting of respondents with prior experience in spa and wellness services. This approach was considered suitable for exploratory and comparative analysis in spa tourism, where access to a fully randomized international sample is difficult to achieve.
The study builds on previous research related to service quality assessment in tourism and hospitality, with a focus on spa and wellness tourism. In line with earlier studies that examined expectations, satisfaction, and perceived service quality, this research focuses on the gap between expected and perceived spa service attributes in a cross-country context.
The main objective was to examine discrepancies between expected and perceived quality attributes of spa services through the application of the SERVQUAL model. The dimensions analyzed include tangibility, reliability, responsiveness, assurance, and empathy across respondents from Slovakia, Slovenia, Croatia, Bosnia and Herzegovina, Montenegro, North Macedonia, and Serbia. The gap is defined as the difference between expected and perceived service attributes.
The SERVQUAL model was selected as the analytical framework due to its frequent use in measuring service quality through the comparison of expectations and perceptions. It is a multidimensional instrument that allows systematic evaluation of service quality across different sectors (Bojičić & Pavlović, 2017; Pavlović et al., 2022). The model measures service quality through five dimensions and evaluates the gap between customer expectations and perceived service performance (Nurrokhman et al., 2023). Developed by Parasuraman, Zeithaml, and Berry, it has been widely applied in tourism and hospitality research (Adane & Javed, 2024; Blešić et al., 2014).
Its application is particularly relevant in spa and wellness tourism, where service quality depends on both tangible elements, such as facilities and equipment, and intangible aspects, such as staff behavior, trust, and personalized attention. The choice of this model is aligned with the research objective, which focuses on the discrepancy between expected and perceived service quality.
The independent variables in this study include country of origin, gender, age, education level, monthly income, and occupation. The dependent variables consist of the five SERVQUAL dimensions: tangibility, reliability, responsiveness, assurance, and empathy. The analysis includes descriptive statistics, t-test for independent samples, correlation analysis, and analysis of variance. Qualitative research methods were also applied where appropriate.
Sample survey
The total research sample consists of 700 respondents (N = 700) with different characteristics in terms of country, gender, age, education level, occupation, and monthly income. A total of 100 respondents were included from each of the seven countries (N = 100). The respondents were selected using a convenience sampling procedure. Data collection was carried out through online questionnaires and direct distribution in spa and wellness centers, depending on the country, which enabled access to individuals with prior experience in spa services. The inclusion criterion required that respondents had previous experience with spa and or wellness services. Participation in the survey was voluntary and anonymous, and respondents were informed that the data would be used only for academic and scientific purposes.
Although the sample was balanced in terms of the number of respondents per country, it cannot be considered fully representative of the overall population of spa service users in the observed countries. The use of a convenience sample limits the generalization of the findings, so the results should be interpreted with caution. The findings are analytically relevant and indicative, especially for comparative analysis, but they do not allow broad general conclusions about the entire population of spa service users. Such forms of tourism contribute to maintaining health and improving the quality of life of users (Pavlović et al., 2017).
For data analysis, both descriptive and inferential statistical methods were applied. Descriptive statistics were used to present measures of central tendency and variability in respondents’ answers. The reliability of the research instrument was tested using Cronbach’s alpha coefficient, while the normality of data distribution was examined using the Kolmogorov–Smirnov test, along with skewness and kurtosis values. Since statistically significant deviations from normal distribution were identified, non-parametric statistical methods were used in further analysis.
The Wilcoxon signed-rank test was applied to examine differences between expected and perceived quality attributes within the same group of respondents. The Mann–Whitney U test was used to compare differences between two independent groups, while the Kruskal–Wallis test was applied for comparisons involving three or more independent groups. These statistical methods are suitable given the ordinal nature of Likert-scale data and the identified distribution characteristics. The use of non-parametric tests follows standard methodological recommendations in social sciences when dealing with ordinal data and non-normal distributions, which supports the validity of the results.
Table 1. Structure of the sample in relation to the country of origin of the respondents
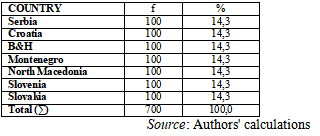
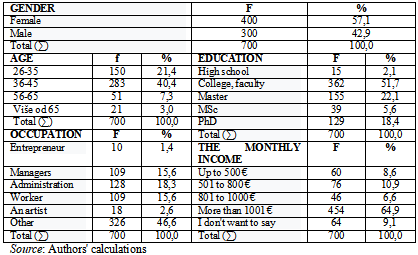
Table 2. Structure of the sample in relation to gender, age, professional education, financial and social status of the respondents
Research results
Before presenting the research results, it is necessary to assess the reliability of the instruments and examine the normality of the data distribution. The study applied two scales that measure expected and perceived attributes of spa services, as well as the discrepancy between them based on the Gap model.
Both scales, expected and perceived attributes, consist of 26 statements grouped into five dimensions or subscales: tangibility (7 statements), reliability (5 statements), responsiveness (6 statements), assurance (5 statements), and empathy (3 statements). The scales are designed as five-point Likert-type instruments, with response options ranging from 1, indicating complete disagreement, to 5, indicating complete agreement.
Responsiveness of the instrument
The results indicate high reliability for both applied subscales. The obtained Cronbach’s alpha coefficients were α = 0.969 for the scale of expected attributes and α = 0.950 for the scale of perceived service attributes. Both coefficients are considered very high. These findings confirm a strong level of internal consistency of the measurement instrument and indicate that the questionnaire items are appropriate for assessing the observed dimensions of spa service quality.
Normality of distribution of results
The normality of the data distribution was examined using the Kolmogorov–Smirnov test, as well as skewness and kurtosis values. The results show statistically significant deviations from normal distribution for all five dimensions on the scale of expected quality attributes of spa services. Skewness values are slightly negative across all dimensions, while kurtosis values are positive and range from slight to moderate levels.
On the scale of perceived attributes of spa services (Table 3), statistically significant deviations from normal distribution were also identified for all five dimensions. Skewness values are moderately negative across all dimensions. Kurtosis values are moderately positive for perceived tangibility and perceived responsiveness, while they are moderately negative for perceived reliability, assurance, and empathy.
Table 3. Checking the normality of the distribution of results on the scale of perceived
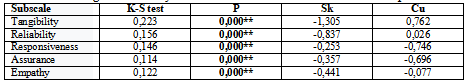
df=700; p<0,01**; Source: Authors' calculations
Given the statistically significant deviations from normal distribution identified for all dimensions of both scales, expected and perceived spa service quality attributes, non-parametric statistical methods were applied in further analysis. The use of non-parametric procedures is justified not only by the distribution characteristics of the data but also by the ordinal nature of Likert-type scales, which are commonly analyzed using rank-based methods in social science research.
SERVQUAL Model
The general objective of this research was to examine the discrepancy between expected and perceived quality attributes of spa services using the SERVQUAL model among respondents from Serbia, Montenegro, Bosnia and Herzegovina, North Macedonia, Croatia, Slovenia, and Slovakia. The discrepancy, defined through the Gap model, is expressed as the difference between expected and perceived spa service attributes.
Table 4. Differences between expected and observed quality attributes of spa services
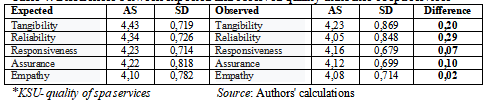
According to the level of expression of the measured dimensions (Table 4), on the scale of expected attributes of spa services, the highest mean value was recorded for the dimension tangibility (M = 4.43, SD = 0.719). This was followed by reliability, responsiveness, and assurance, while the lowest mean value was recorded for expected empathy (M = 4.10, SD = 0.782).
On the scale of perceived attributes of spa service quality, the highest mean value was also observed for perceived tangibility (M = 4.23, SD = 0.869). This was followed by perceived reliability, responsiveness, and assurance, while the lowest mean value was recorded for perceived empathy (M = 4.08, SD = 0.714).
These findings indicate that respondents generally evaluate spa services positively. At the same time, certain dimensions show differences between expected and perceived values, which indicates areas where improvements in service delivery may be needed.
Graph 1. The difference between expected and perceived attributes of spa services
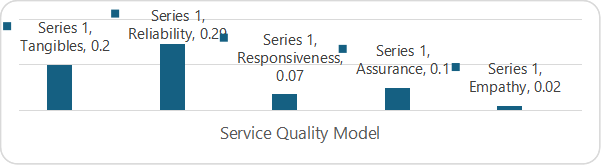
Table 5. Significance of differences in the expressiveness of expected and observed attributes of spa services
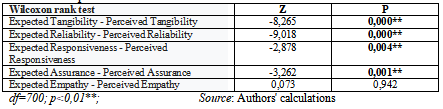
Differences between expected and perceived attributes of spa services, expressed in absolute values, show that the largest gap was recorded for the reliability dimension (0.29). This is followed by tangibility (0.20) and assurance (0.10). The smallest gap was observed for empathy, with a value of 0.02. The significance of differences between expected and perceived quality attributes was tested using the Wilcoxon signed-rank test (Table 5). Statistically significant differences were identified for tangibility, reliability, responsiveness, and assurance. All differences are significant at the level of p < 0.01. The largest difference was found for responsiveness (Z = −9.018, p = 0.000). No statistically significant difference was found for the empathy dimension. These findings indicate that respondents show greater sensitivity to operational aspects of spa service quality than to interpersonal aspects. Greater attention is given to consistency and reliability of service delivery than to the evaluation of employee empathy. This suggests that consistent service performance and reliability are key factors in shaping perceived service quality in spa tourism.
Comparative analysis
The respondent's country of origin
Based on the comparative analysis of scores on the scale of expected spa service quality in relation to the country of origin, differences were observed across dimensions (Table 6). For expected tangibility, the highest scores were reported by respondents from Croatia. For expected responsiveness and expected empathy, the highest scores were reported by respondents from North Macedonia. For expected reliability and expected assurance, the highest scores were reported by respondents from Montenegro.
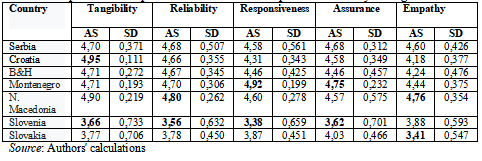
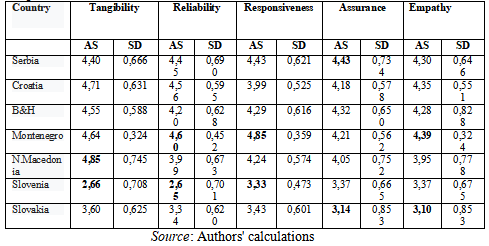
Table 6. Expression of expected in relation to the respondent's country of origin
Source: Authors' calculations
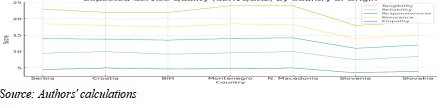
On the scale of expected spa service attributes, respondents from Slovenia reported the lowest scores for expected tangibility, reliability, responsiveness, and assurance. The lowest score for expected empathy was recorded among respondents from Slovakia (Chart 2).
Chart 2. Expected quality attributes of spa services in relation to the respondents' country of origin
On the scale of perceived spa service attributes, as presented in Table 7, the highest scores were recorded among respondents from Montenegro for perceived reliability, responsiveness, and empathy. Respondents from North Macedonia reported the highest score for perceived tangibility, while respondents from Serbia reported the highest score for perceived assurance.
Table 7. Prominence of perceived in relation to the country of origin of the respondents
The differences in the expressiveness of the expected and perceived quality attributes of spa services in relation to the respondents' country of origin are shown in the Table 8.
Table 8. Comparison of the differences in the expression of observed and expected in relation to the country of origin of the respondents
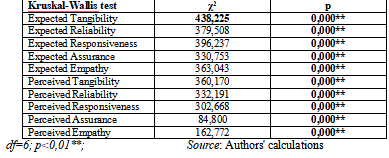
Statistically significant differences were identified across all five dimensions of the expected scale and all five dimensions of the perceived scale. These findings indicate that spa service quality cannot be viewed as uniform across different national contexts. Differences in expectations and perceptions may reflect variations in service culture, tourism development, prior consumer experience, and market standards across countries. The results confirm that user evaluations of spa services depend on context. All identified differences are statistically significant at the level of p < 0.01. According to the Kruskal–Wallis test, the largest difference was observed for expected tangibility (χ² = 438.225, p < 0.001), while the smallest difference was recorded for perceived assurance (χ² = 84.800, p = 0.000).
Further analysis shows that, for expected tangibility, respondents from Croatia reported significantly higher scores than respondents from all other countries. Respondents from Slovenia reported significantly lower scores compared to respondents from Serbia, Croatia, Montenegro, Bosnia and Herzegovina, and North Macedonia. The lowest value on this dimension was recorded in Slovenia, and the highest in Croatia. For expected responsiveness, the highest scores were reported by respondents from North Macedonia, while the lowest scores were recorded in Slovenia. Respondents from Slovenia and Slovakia reported significantly lower scores compared to respondents from Serbia, Croatia, Montenegro, Bosnia and Herzegovina, and North Macedonia.
For expected reliability and expected assurance, the highest scores were recorded among respondents from Montenegro, while the lowest were observed in Slovenia. Respondents from Slovenia reported significantly lower scores than respondents from all other countries, while respondents from Slovakia also reported lower scores compared to most countries, except Slovenia. For expected empathy, the highest scores were recorded in North Macedonia and the lowest in Slovakia. Respondents from North Macedonia reported significantly higher scores than respondents from all other countries, while respondents from Slovakia reported significantly lower scores compared to respondents from Serbia, Croatia, Montenegro, Bosnia and Herzegovina, and North Macedonia.
For perceived tangibility, respondents from North Macedonia reported significantly higher scores compared to respondents from Serbia, Bosnia and Herzegovina, Slovakia, Slovenia, and Montenegro. Respondents from Slovenia and Slovakia reported significantly lower scores than respondents from other countries. For perceived responsiveness, respondents from Montenegro reported significantly higher scores compared to all other countries. Respondents from Slovakia reported the lowest scores, while respondents from Slovenia also reported lower scores compared to most countries. Respondents from Croatia reported higher scores than respondents from North Macedonia, Bosnia and Herzegovina, Slovenia, and Slovakia.
For perceived assurance, respondents from Slovakia reported significantly lower scores compared to respondents from all other countries. A similar pattern was observed for perceived empathy, where respondents from Slovakia reported significantly lower levels compared to respondents from the other countries.
Gender of the respondent
According to the differences in expected and perceived spa service quality attributes in relation to gender (Table 9), statistically significant differences were identified for expected responsiveness (Z = −2.078, p = 0.038) and expected assurance (Z = 2.142, p = 0.032). Both differences are significant at the level of p < 0.05.
The results indicate that female respondents report higher perceived responsiveness compared to male respondents. For perceived assurance, male respondents report higher levels compared to female respondents.
Table 9. Comparison of the differences in the expression of observed and expected in relation to the sex of the respondents
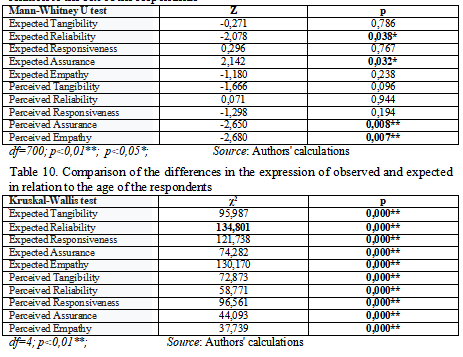
On the dimensions of the scale of perceived attributes of the quality of spa services, statistically significant differences in relation to gender were confirmed for the dimensions perceived Assurance (Z=-2.650, p=0.008) and perceived Empathy (Z=-2.680, p=0.007). Both obtained differences are significant at the significance level of p<0.01 and show that female respondents show significantly higher satisfaction with these dimensions compared to male respondents.
Age of the respondent
Regarding the age of respondents (Table 10), statistically significant differences were identified in both expected and perceived spa service quality attributes across all dimensions. All differences are significant at the level of p < 0.01. According to the Kruskal–Wallis test, the largest difference was recorded for expected responsiveness (χ² = 134.801, p = 0.000), while the smallest difference was observed for perceived empathy (χ² = 37.739, p = 0.000).
For the perceived quality dimensions, respondents aged 25 to 35 and 36 to 45 reported significantly lower values compared to respondents aged 46 to 55 and 56 to 65. In general, respondents in the 25 to 45 age groups showed both lower expectations and lower perceived quality of spa services.
One possible explanation is that younger and middle-aged respondents approach spa and wellness services with different preferences and usage patterns compared to older users. These groups may place more emphasis on service organization, consistency, and overall experience, which may influence both their expectations and their evaluations of service quality.
Education of the respondents
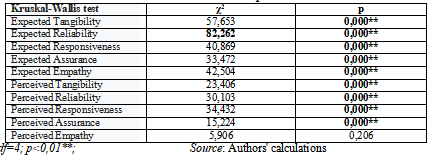
According to the level of education of the respondents (Table 11), statistically significant differences in spa service quality were identified across all dimensions of the expected attributes scale. For the perceived attributes scale, statistically significant differences were found for perceived tangibility, reliability, assurance, and empathy. All identified differences are significant at the level of p < 0.01. According to the Kruskal–Wallis test, the largest difference was observed for expected responsiveness (χ² = 82.262, p = 0.000), while the smallest difference was recorded for perceived assurance (χ² = 15.224, p = 0.000).
No statistically significant differences were found for the perceived empathy dimension in relation to the level of education of respondents.
Table 11. Comparison of the differences in the expression of observed and expected KSU in relation to the level of education of the respondents
Further analysis shows that, for expected tangibility, reliability, responsiveness, and assurance, respondents with doctoral and master’s degrees reported significantly higher scores compared to respondents with college or university education. Similar results were observed for expected empathy, where respondents with doctoral and master’s degrees reported higher expectations than those with lower levels of education.
For the perceived quality scale, respondents with doctoral and master’s degrees also reported higher scores on the reliability dimension compared to respondents with college or university education. On perceived tangibility and reliability, respondents with doctoral degrees showed significantly higher scores compared to all other education groups, while respondents with master’s degrees also reported higher scores than those with lower education levels. On perceived assurance, respondents with doctoral and master’s degrees reported higher scores compared to respondents with secondary or university education.
In general, respondents with higher levels of education, particularly those with doctoral and master’s degrees, show both higher expectations and higher evaluations of perceived service quality compared to respondents with lower education levels. This pattern suggests that more highly educated respondents apply more demanding and differentiated criteria when evaluating service quality. These respondents may pay more attention to organizational aspects, professionalism, communication, and consistency of service delivery, which makes them an important segment in spa tourism.
The amount of the respondent's monthly income
Comparative analysis by monthly income (Table 12) shows statistically significant differences in the scores for both expected and perceived spa service quality across all dimensions. All differences are significant at the level of p < 0.01. According to the Kruskal–Wallis test, the largest difference was observed for expected responsiveness (χ² = 138.285, p = 0.000), while the smallest difference was recorded for perceived assurance (χ² = 62.479, p = 0.000).
Table 12. Comparison of differences in the expression of observed and expected in relation to the amount of monthly income of respondents
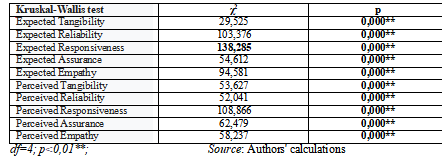
Further analysis shows that, for expected tangibility, responsiveness, assurance, and empathy, respondents with monthly incomes above 1001€ reported significantly lower scores compared to respondents with lower income levels and those who chose not to disclose their income. On expected responsiveness, respondents with incomes above 1001€ also reported lower scores than all other groups. In addition, respondents with incomes between 801€ and 1000€ reported lower expectations compared to respondents with incomes up to 500€, those with incomes between 501€ and 800€, and those who did not disclose their income.
For the perceived attributes of spa services, respondents with incomes up to 500€ reported significantly higher scores across all dimensions compared to respondents with higher income levels. Respondents who did not disclose their income also reported higher perceived scores compared to respondents with incomes between 801€ and 1000€ and those with incomes above 1000€.
These findings suggest that respondents with lower income levels tend to evaluate spa services more positively, which may be related to more moderate expectations or the higher perceived value of such services. Respondents with higher incomes may apply stricter evaluation criteria and compare services with a wider range of previous experiences.
Respondent's occupation
Regarding the occupation of respondents (Table 13), statistically significant differences were identified in both expected and perceived spa service quality across all dimensions. All differences are significant at the level of p < 0.01. According to the Kruskal–Wallis test, the largest difference was observed for perceived responsiveness (χ² = 116.330, p = 0.000), while the smallest difference was recorded for perceived assurance (χ² = 44.170, p = 0.000).
Table 13. Comparison of the differences in the expression of perceived and expected in relation to the occupation of the respondents
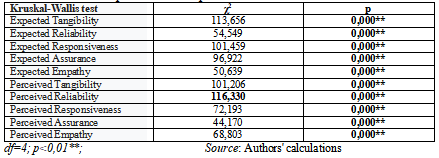
Further analysis shows that, across all dimensions of both expected and perceived spa service quality, respondents classified as workers or in the “other” occupation category reported significantly lower scores compared to all other occupational groups.
At the same time, these groups display relatively high expectations alongside their evaluations of perceived service quality. This pattern indicates that spa service users form a heterogeneous group, and their evaluations vary depending on professional background and lifestyle.
These findings should be interpreted with caution due to the uneven occupational structure of the sample. A large proportion of respondents, more than 45 percent, fall into the “other” category, which may influence the stability and interpretation of the results.
Discussion
The results of this study indicate that, although the differences between expected and perceived spa service quality are not large in absolute terms, they remain relevant from both theoretical and managerial perspectives. The identified gaps show that spa service users in Central and Southeastern Europe generally evaluate service quality positively, but they remain sensitive to specific shortcomings in service delivery. The most notable finding is that the largest gap was identified in the responsiveness dimension. Similar results were reported by Blešić et al. (2014), who identified reliability and responsiveness as key determinants of service quality in spa hotels. This indicates that users are particularly sensitive to inconsistencies in service delivery and place importance on dependability and trust.
Responsiveness has particular importance in spa and wellness tourism because these services are associated not only with leisure but also with health, recovery, relaxation, and overall well-being. Any inconsistency between expected and delivered service may therefore be perceived more strongly. This finding is consistent with established service quality literature, which explains that users evaluate service quality through the comparison of expectations and actual service performance (Parasuraman et al., 1991; Grönroos, 1984).
A noticeable gap was also identified in the tangibility dimension. This result is expected due to the experiential nature of spa tourism. Physical environment, visual appearance, hygiene, ambiance, and equipment quality influence initial impressions and overall evaluations. Even when the core service is satisfactory, limitations in physical aspects may affect the perceived quality. This finding is consistent with previous research that highlights the importance of the service environment in spa tourism (Papadopoulou, 2020; Badulescu et al., 2024).
Empathy is the only dimension for which no statistically significant difference was identified between expectations and perceptions. Similar findings have been reported in earlier studies, where interpersonal aspects of service quality were evaluated more positively than functional aspects (Badulescu et al., 2024). This suggests that spa service providers in the observed region are relatively successful in delivering interpersonal elements such as courtesy, attention, and communication with guests.
The identified cross-country differences further indicate that expectations and perceptions of spa service quality depend on broader national and market contexts. These differences may reflect variations in tourism development, service standards, and prior user experience. This supports the view that service quality in spa tourism should be interpreted as context-dependent rather than uniform across countries.
Findings related to age, education, income, and occupation confirm that spa service users represent a heterogeneous group. Differences in expectations and evaluations suggest that users apply different criteria based on their characteristics. This has practical implications, as it indicates that spa and wellness providers should consider segmentation and service adaptation in order to meet diverse user needs.
From a theoretical perspective, this study contributes to existing literature in several ways. It confirms the applicability of the SERVQUAL framework in spa tourism research. It also shows that service quality is a multidimensional concept influenced by both service performance and user characteristics. In addition, the inclusion of respondents from seven countries provides a comparative regional perspective that is less represented in existing research. The study extends previous work by offering a cross-country analysis and highlighting the context-dependent nature of spa service quality.
Conclusions
This study examined the differences between expected and perceived quality attributes of spa services among respondents from seven countries in Central and Southeastern Europe: Slovakia, Slovenia, Croatia, Bosnia and Herzegovina, Montenegro, North Macedonia, and Serbia. The sample included 700 respondents of different gender, age, education level, occupation, and monthly income. The analysis was based on the SERVQUAL model and included five dimensions of spa service quality: Tangibility, Reliability, Responsiveness, Assurance, and Empathy.
The results showed relatively small differences between expected and perceived spa service quality at the level of the total sample. This indicates a generally positive evaluation of spa services among respondents. However, statistically significant differences were found for all dimensions except Empathy, which suggests that some quality gaps still exist despite the overall positive evaluation. The largest discrepancy was identified in the Reliability dimension, followed by Tangibility and Assurance, while the smallest difference was found in Empathy. These findings suggest that users are particularly sensitive to service consistency, dependability, and the physical environment of spa facilities.
The study also confirmed that differences in expected and perceived service quality are significantly related to selected socio-demographic characteristics, including country of origin, age, education, income, and occupation. This indicates that spa service users do not represent a homogeneous group, since their expectations and evaluations differ across user categories and national contexts. Service quality in spa tourism should therefore be understood as a multidimensional and context-dependent construct.
From a theoretical perspective, the study contributes to the existing literature by confirming the applicability of the SERVQUAL model in the context of spa and wellness tourism and by extending previous research through a comparative multi-country approach. The findings also show the importance of examining service quality through the discrepancy between what users expect and what they perceive.
From a practical perspective, the results may be useful for spa managers and decision-makers in designing more targeted service improvement strategies. Particular attention should be directed toward the dimensions in which the largest discrepancies were identified, especially those related to service reliability, operational consistency, and the tangible aspects of the spa experience. The identified socio-demographic differences also suggest that service providers should apply a more segmented and user-oriented approach in order to better align service delivery with the expectations of different customer groups.
The study has several limitations. The research was based on a convenience sample and a cross-sectional design, which limits broader generalization of the findings. Future research should include more representative samples, additional psychographic and behavioral variables, and longitudinal approaches in order to provide a more comprehensive understanding of spa service quality and consumer behavior in tourism.
References
2.Adane, D. T., & Javed, M. (2024). Service Quality of the Wellness and Spa Centers in the Czech Republic: Application of SERQUAL Model. INPROFORUM 2024, 53.
3.Badulescu, D., Saveanu, T, Trip, D.T. Badulescu, A. (2024). Business Opportunities and Drivers for Health and Spa Tourism: A Qualitative Research on Baile Felix Spa Resort, Romania. Sustainability, 16, 1807. https://doi.org/10.3390/su16051807
4.Blešić, I., Popov-Raljić, J., Uravić, L., Stankov, U., Đeri, L., Pantelić, M., & Armenski, T. (2014). An importance-performance analysis of service quality in spa hotels. Economic research-Ekonomska istraživanja, 27(1), 483-495.
5.Badulescu, D., Saveanu, T., Trip, D. T., & Badulescu, A. (2024). Business opportunities and drivers for health and Spa tourism: A qualitative research on Baile Felix Spa resort, Romania. Sustainability, 16(5), 1807.
6.Bacsi, Z., Kovács, E., Loke, Z. (2024). The tourism performance of spa destinations during crises in Central and Eastern Europe: An adjusted RCA index, Helinon, Volume 10, Issue 19, e38257 Volume 10, Issue 19e38257October 15.
7.Бојичић, Р., & Павловић, М. (2017). ТЕСТИРАЊЕ ДИМЕНЗИЈА КВАЛИТЕТА БАНКАРСКИХ УСЛУГА У СРБИЈИ И БЛИЖЕМ ОКРУЖЕЊУ РАДИ УНАПРЕЂЕЊА УСЛУГА. Economic Outlook/Ekonomski Pogledi, 19(2).
8.Dąbrowski, D., Jalinik, M., Sokół, J.L., Radwańska, K., Niźnikowska, E., Deikun, K. (2021). Development and Evaluation of Spa Tourism in the Area of Podkarpackie Voivodeship and Lviv Region, European Research Studies Journal Volume XXIV, Issue 4, pp. 396-412.
9.Qu, M. (2025). Exploring tourist perceptions and expectations of spa tourism in Mile City, China: a grounded theory approach, J. Geogr. Inst. Cvijic, 75(1), pp. 51–66.
10.Gronroos, C.; Grönroos, C.; Gronroos, C. A Service Quality Model and its Marketing Implications. Eur. J. Mark. 1984, 18, 36–44.
11.Nurrokhman, A., Trihandayani, E., & Nurapipah, A. (2024). Analisis Kualitas Pelayanan Jasa SPA dengan Metode Service Quality (Servqual) dan Teoriya Resheniya Izobreatatlskikh Zadatch (TRIZ) di Aleenahoz Beauty Jakarta: Analysis of SPA Service Quality using Servqual and TRIZ Method at Aleenahoz Beauty Jakarta. Jurnal Riset Jakarta, 16(1), 33-40. https://doi.org/10.37439/jurnaldrd.v16i1.84
12.Hashemi, S.M., Jusoh, J., Kiumarsi, S., Mohammadi, S. (2015). Influence factors of spa and wellness tourism on revisit intention: the mediating role of international tourist motivation and tourist satisfaction, International Journal of Research–GRANTHAALAYAH, Vol 3 (issue 7), DOI: https://doi.org/10.29121/granthaalayah.v3.i7.2015.2976
13.Kantorová, K., Mlázovský, M., Svoboda, O. (2023). Customer Loyalty in Spa Tourism: A Case Study, Proceedings of the 6th International Conference on Tourism Research, ICTR 2023 Vol. 6. No. 1Papadopoulou, G. (2020). Spa Tourism in Europe: An Economic Approach, Athens Journal of Tourism - Volume 7, Issue 3, September 2020 – Pages 133-144 https://doi.org/10.30958/ajt.7-3-1 doi=10.30958/ajt.7-3-1
14.Pavlović, M., Radonjić, A., & Pavlović, Đorđe. (2023). BEHAVIOR OF USERS OF BANKING SERVICES IN THE REPUBLIC OF SERBIA, BOSNIA AND HERZEGOVINA DURING THE PANDEMIC OF COVID-19. Ekonomija - Teorija I Praksa, 16(1), 120–139. Retrieved from https://casopis.fimek.edu.rs/index.php/etp/article/view/202
15.Pavlović, M., Bojičić, R. R., & Ratković, M. C. (2018). Customer satisfaction with postal services in Serbia. Management: Journal of Sustainable Business and Management Solutions in Emerging Economies, 23(3), 15-33.
16.Pavlovic, M., Stojanovic, R., Peric, M., & Tesic, B. (2024). Indicators of User Satisfaction of Spa Services in Southern Serbia. Oditor, 58.
17.Pelegrín-Borondo, J., Araújo-Vila, N., Fraiz-Brea, J.A. (2020). Comparison of Spa Choice between Wellness Tourists and Healthcare/Medical Tourists, Healthcare (Basel), 8(4):544. doi: 10.3390/healthcare8040544
18.Parasuraman, A., Berry, L. L., & Zeithaml, V. A. (1991). Perceived service quality as a customer-based performance measure: An empirical examination of organizational barriers using an extended service quality model. Human Resource Management, 30(3), 335–364.
19.Papadopoulou, G. (2020). Spa tourism in Europe: An economic approach. Athens Journal of Tourism, 7(3), 133-134.
20.Premović, J. (2021). Sociološko-kulturološki uticaji turizma u kontekstu širenja vrednosnih vidika u zemljama Zapadnog Balkana, Međunarodni naučni skup EКOM 2021: Značaj Mini Šengena za evrointegrcije Zapadnog Balkana, ISSN 978-86-80127-98-9, Ekonomski fakultet Univerziteta u Prištini sa privremenim sedištem u Кosovskoj Mitrovici, Кosovska Mitrovica, Srbija.
21.Suban, S. A. (2025). Visitor’s emotional experience in predicting destination image, satisfaction and intention to revisit: a spa tourism perspective, International Hospitality Review, Vol. 39 No. 2, pp. 355-376, DOI 10.1108/IHR-05-2023-0032.
22.Sangpikul, A. (2023). Understanding a Conceptual Framework of Spa Service Quality: An Overview Approach. Academica Turistica - Tourism and Innovation Journal, 16(3). Retrieved from https://academica.turistica.si/index.php/AT-TIJ/article/view/567
23.Sasser, W.E.; Olsen, R.P.; Wyckoff, D.D.; Harvard University.Graduate School of Business Administration. Management of Service Operations: Text, Cases, and Readings; Allyn and Bacon: Boston, MA, USA, 1978; Available online: https://www.mendeley.com/ catalogue/c8d0fa2c-05aa-395d-8001-261f6f9575cc/?utm_source=desktop (accessed on 10 December 2025).
24.Quester, P. G., Romaniuk, S., & Wilkinson, J. W. (2015). A test of four service quality measurement scales: The case of the Australian advertising industry. In Proceedings of the 1995 World Marketing Congress pp. 384–391.
Published in
Vol. 12 No. 1 (2026)
Keywords
🛡️ Licence and usage rights
This work is published under the Creative Commons Attribution 4.0 International (CC BY 4.0).
Authors retain copyright over their work.
Use, distribution, and adaptation of the work, including commercial use, is permitted with clear attribution to the original author and source.
Interested in Similar Research?
Browse All Articles and Journals