Determining Relationship between Economic Growth and Environmental Protection
Abstract
The subject of this paper is the analysis of the relationship between economic growth and the environment performance. The authors have investigated the EPI index while our research covered the period 2010-2018. The findings reveal that environmental policy directly and positively influences economic performance through the improvement of environmental conditions. However, many analysts fear that the demands of the green economy already create high costs, and that its benefits will be materialized in the long term. Finally, sustainable business operations - the green economy requires timely harmonization, in order to fulfill the goals of environmental protection.
Article
Introduction
The reason for introducing the concept of green growth lies in the fact that modern economies, in order to achieve economic growth, influence the environment and jeopardize the possibility of achieving sustainable growth. The “Green Growth Strategy for Research and Publications” has been adopted by OECD (OECD, 2012a). The basic meaning of the concept of green growth can be explained as economic growth (GDP growth), that achieves significant environmental protection. Some definitions of green growth do not specify the precise level of environmental protection.
Sustainable development is the basic principle of environmental policy. Economic growth of about 10% per year over the past 30 years has helped China, while the Chinese government continues to develop strategies that will allow the continuation of rapid growth striving to "green" the process of development (OECD, 2011; Ouyang, et. al 2019).
According to the research of Hsu et al. (2016) the correlation between Environmental Performance Index (EPI) and per capita; good governance; and human development index (HDI) has been determined. The authors have tried to answer the question of whether economic competitiveness must be sacrificed in order to achieve an environmental protection success, as traditional economic theory had previously suggested. They conclude that there is a statistically significant correlation between GDP per capita and EPI. However, there are differences in EPI results in countries with the same level of income. Even countries like Sweden and Belgium differ significantly in EPI results. The conclusion is that all countries with a GDP per capita over 10,000 dollars have EPI results greater than 65. Also, there are significant variations in EPI results among the poor countries, while the poorest countries have results below 60 (Vaninsky, 2019).
Many studies argue that environmental issues will be "solved" with economic development (Grossman, 1995; Feng, Tang, Yu, 2019). This argument has several drawbacks. For example, poor households, struggling for food and accommodation, will put less priority on the benefits provided by the green park. However, wealthy households are more interested in solving soil degradation problems that reduce agricultural yields, as well as the lack of solid waste management that leads to epidemics, blockage of urban sewers, floods, and so on. Strategy that focuses on “grow dirty and clean up later" is not acceptable. They are particularly unacceptable in developing countries. And what's even worse is the damage that cannot be repaired (Krstić, Krstić, 2016).
Most European countries have introduced a number of environmental tax measures, with the aim of providing environmental benefits. Tax policy makers have directed environmental taxes (Ilić, 2019), that is, the tax burden from the labor factor to the environmental factor, by directly imposing environmental taxes to the sectors responsible for environmental pollution. The highest revenues from environmental taxes and other economic instruments are generated by the Scandinavian countries. Funds raised through these taxes they are intended to finance environmental projects (Kiurski et al., 2019b).
All efforts should focus on what needs to be done in the next five to ten years in order to maintain growth, avoiding, of course, administrative barriers, but also preventing irreparable damage to the environment (OECD, 2012b; Qu, Long, 2018).
Environmental policy increases the economic performance directly through the improvement of environmental conditions. But green policies can also indirectly affect economic development, as well as increase efficiency and environmental benefits. Environmental Policy can in several ways contribute to GDP growth (World Bank, 2012b; Drews, et. al., 2018):
1) Green policies can help to increase available capital and labor, which will have an impact on an increased production. E.g. if the land it is better managed and utilized, it will be more productive; better management of natural risks can as a result have fewer losses in case of natural disasters; a healthier environment can have a positive impact on the productivity of workers.
2) Principle of efficiency. Efficiency is achieved by increased productivity and by more efficient use of resources. One of the examples can found in energy efficiency. By imposing ecological taxes and eliminating harmful subsidies, a fiscal space for governments is created. Countries can reduce taxes on labor or subsidize public green services and products, such as public transport or renewable energy.
3) Green policies stimulate innovation. Recent research shows that well- designed environmental regulations stimulate innovation in firms.
4) Green policies can also affect the general welfare.
Green companies primarily focus on preserving natural resources and protecting the environment. Today, sustainability has become a driving force, but also a priority in the business operations of socially responsible companies. This force is the one that can bring positive changes both in business and in technology and production processes. Financial assistance provided by the state for the development of green technology, as well as appropriate legislation in this area, is a safe path to a sustainable future (Čajka, Jovanović, 2014).
The trend of increasing air pollutants or pollution can be expected in the future due to the constant influx of population into the urban environment and the steady increase in the amount of coal that is burned (Kiurski et al., 2019a). Green policy creators need to measure the level of compromise between the costs and benefits of environmental policies.
The purpose of the work and the applied methodology
In 1956, Robert Solow, American economist, winner of the Nobel Prize in Economics in 1987, has introduced the classic model of growth (Solow, 1956; Khan, Peng, Li, 2019). Robert Solow's classic growth theory assumes that the growth is a result of the use of technology, capital and labor, and its relationship is as follows:
Y = f (A, K, L)
Y is growth, A - technology and human capital, K - physical capital, L -
labor.
What is lacking in the Solow model is the environment as a factor of production. “In the early 1970s, that classical growth theory was modified to embrace the environment” that has been introduced under the term "natural capital", as one of the factors of production (World Bank, 2012a, p.34; Liang, Yang, 2019).
When the environment, as a natural capital, is included as one of the factors of production, then the production function is shown as follows (Hallegatte et al., 2011):
Y = f (A, K, L, E)
where Y is growth, A - technology and human capital, K - physical capital, L
- labor, E - environment (natural capital)
Table 1. EPI index – construction
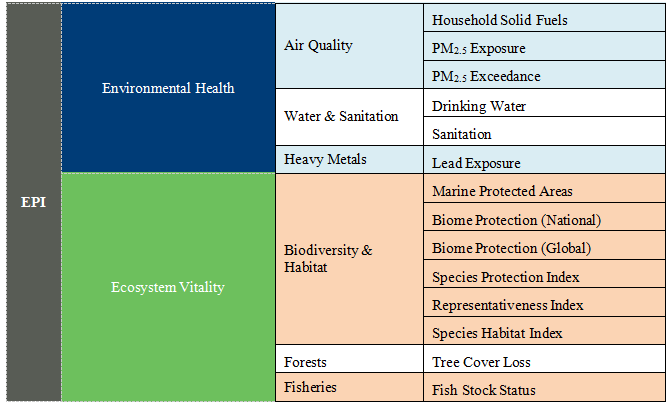
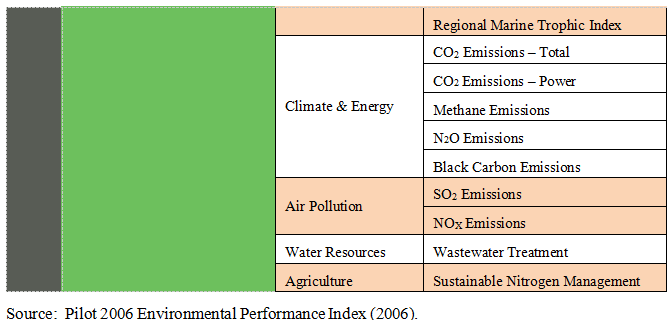
If the environment is considered as capital and to invest in it does make sense, then the environmental policy can also be considered as an investment. The Environmental Health (EH) is composed of EH - Health Impacts, EH - Air Quality and EH - Water and Sanitation, and the vitality of ecosystem (EV) of: EV – Agriculture, EV – Forests, EV – Fisheries, EV - Biodiversity and Habitat, EV - Climate and Energy and EV Air Pollution. The creators of the EPI index at the Yale Center for Environmental Law & Policy and The Center for International Earth Science Information Network (CIESIN) at Columbia University’s Earth Institute, (https://epi.envirocenter.yale.edu/) have pointed out that governments are expected to act in order to reduce pollution and manage natural resources. EPI is a composite index comprised of two components of sustainable development: environmental health and vitality of the ecosystem as shown in Table 1. By measuring the areas mentioned above, it is possible to gain an insight into the areas that are more developed or that lag behind in development, so as to define further directions.
For this very reason, the subject of this paper is the analysis of the relationship between economic growth and the environment performance, aiming to emphasize the areas that are under constrain as well as the areas that are positively affected by economic growth. The authors wanted to examine Environmental Health Index and Environmental Health and investigate the Republic of Serbia current position so as to reach adequate results. In our research, we have used the EPI index while author’s research covered the period 2010-2018.
Results and discussion
Quantitative indicators of the environment performance will facilitate the identification of problems, monitor trends, underline the success and failure of policies as well as identify best practices and optimize the return on investment in environmental protection. Analysis of the EPI index shows that Switzerland is at the top of the scale with a score of 87.42 according to the overall environmental performance. It is followed by France (83.95), Denmark (81.60), Malta (80.9) and Sweden (80.51). In the overall EPI index, Denmark, Malta and Sweden have a high score of air quality. In addition, Malta has the highest score in water and sanitation, and Sweden has achieved the highest levels of exposure to lead. Last places are occupied by Nepal (31.44), India (30.57), DR Congo (30.41), Bangladesh (29.56) and Burundi (27.43). The extremely low EPI index values show that countries must work more intensively (especially when it comes to air, protecting biodiversity and reducing the greenhouse effect). Low EPI index values are directly related to poor monitoring and control. In China (120), South Africa (142) and India (177) there is a strong negative tendency. Seychelles, has achieved significant results in increasing its score from 47.05 to 66.02, thanks to its high commitment and fight against greenhouse gas emissions.
Table 2. Values of the EPI index during the period 2010-2018
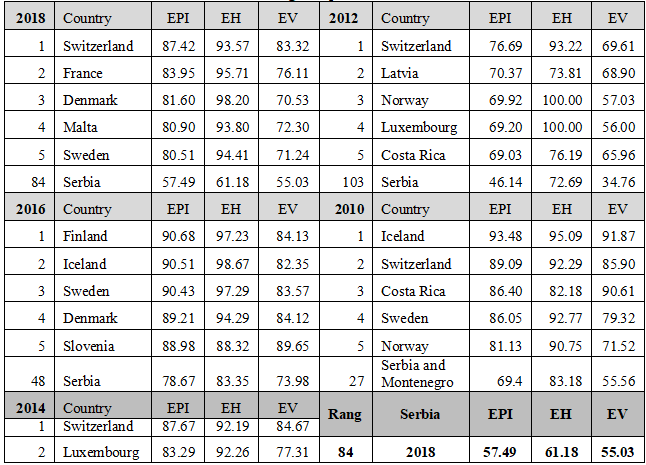
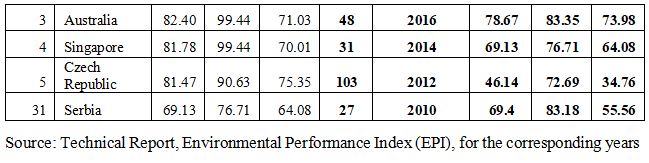
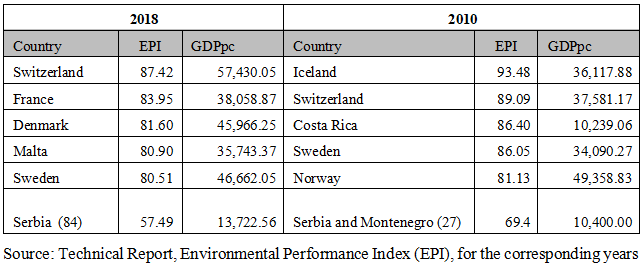
Table 3 shows the relations between the values of the EPI Index and GDP. Countries with a high level of EPI index achieve high GDP and GDP per capita. Rich countries have significant amounts of capital needed for health and the environment. However, in practice, other cases are present. Let’s take as an example, a case of China and India with high GDP, but also very low levels of EPI index. For example Armenia, has a low level of GDP (USD 3,716) and a high level of EPI index (81.5).
However, the research shows that there is a positive relationship between the EPI index and GDP per capita and we can conclude that wealth increases national ecological efficiency. There is a positive relationship between health and GDP per capita, which shows that investment in public health, sanitation and health infrastructure contributes to a healthy environment and represent, indirectly, a condition for economic growth and development.
Table 3. Overview of the EPI Index and GDP in 2010 and 2018
Rich countries and developing countries have financial resources for economic development, respect ecosystems and natural resources management, and pay special attention to improving public health and creating a clean water, sanitation and energy. The EPI index of Serbia indicates that in 2012 the country was at 103 place, which is the worst indicator of the EPI in both areas (EH and EV). After a slight improvement in the period 2014-2016, in the year 2018, the indicators are at the lowest level, with the vitality of the ecosystem in a much worse position. The interdependence between low levels of GDP and low EPI index values has also been observed.
Conclusion
Green growth represents a flexible approach aiming to analyze the green growth. Having in mind economic and environmental challenges, international and national efforts to promote green growth have been intensified during the last decade. This fact can help accelerate progress towards sustainable development and poverty reduction. The green growth is related to economic policy and sustainable development policy, and as such, there are two important requirements that it should fulfill. The EPI index of Serbia indicates that in 2012 the country was at 103 place, with a slight improvement in the period 2014-2016, and in the year 2018 the indicators are at the lowest level, with the vitality of the ecosystem in a much worse position. Vitality of the ecosystem has a much higher share in the total EPI index and its overall score is much lower than the EPI index and EH sub index. In fact, most countries that have a high level of EPI index achieve high levels of GDP and GDP per capita. Countries with high GDP have sufficient resources to implement green policy measures. Although many analysts are afraid that green policies are now generating high costs, and that its benefits shall be shown in future, it is realistic to expect that its benefits can also in the near future. Risk-driven actions should be undertaken now in order to reduce later "regrets" and to avoid significant damages.
References
2.Drews, S., Antal, M., C.J.M. van den Bergh, J. 2018. Challenges in Assessing Public Opinion on Economic Growth Versus Environment: Considering European and US Data, Ecological Economics, 146, 265- 272, https://doi.org/10.1016/j.ecolecon.2017.11.006.
3.Grossman, G.M. & A.B: Krueger. 1995. Economic Growth and the Enviroment. Quarterly Journal of Economics 110, (2): 353-377.
4.Feng, J.C., Tang, S., Yu, Z. 2019. Integrated Development of Economic Growth, Energy Consumption, and Environment Protection from Different Regions: Based on City Level, Energy Procedia, 158, 4268- 4273, https://doi.org/10.1016/j.egypro.2019.01.799.
5.Hallegatte, S., Heal, G., Fay, M. & D. Treguer. 2011. From growth to green growth - a framework. Policy Research Working Paper Series 5872. The World Bank.
6.Hsu, A., Esty, D. C., de Sherbinin, A., Levy, M. A., & al. 2016 Environmental Performance Index. New Haven, CT: Yale University. Retrieved from: www.epi.yale.edu
7.Ilić, B. (2019). Cena zemlje kao faktor održivog razvoja. Održivi razvoj, 1(2), 7-16.
8.Khan, S., Peng, Z., Li, Y. 2019. Energy consumption, environmental degradation, economic growth and financial development in globe: Dynamic simultaneous equations panel analysis, Energy Reports, 5, 1089-1102, https://doi.org/10.1016/j.egyr.2019.08.004.
9.Kiurski J., Ralević N., Ignjatijević, S., Vapa-Tankosić J. & D. Soleša. 2019a. Analysis of air quality indicators at children’s playgrounds, Air Quality, Atmosphere & Health 12, (8): 955-962. ISSN: 1873-9326.
10.Kiurski J., Soleša, D., Ignjatijević, S. & J. Vapa-Tankosić. 2019b. Karakteristični aeropolutanti Novog Sada, Univerzitet Privredna akademija u Novom Sadu Fakultet za ekonomiju i inženjerski menadžment. Novi Sad: FTN Izdavaštvo Edicija "Tehničke nauke - Udžbenici". ISBN 978-86-7892-314-2.
11.Krstić, B., Krstić, M. (2016). Teorija racionalnog izbora i društvena istraživanja. Sociologija, 58(4), 598-611.
12.Liang, W., Yang, M. 2019. Urbanization, economic growth and environmental pollution: Evidence from China, Sustainable Computing: Informatics and Systems, 21, 1-9
13.Ouyang, X., Shao, Q., Zhu, X., He, Q., Xiang, C., Wei, G. 2019. Environmental regulation, economic growth and air pollution: Panel threshold analysis for OECD countries, Science of The Total Environment, 657, 234-241,
14.OECD. 2011. Towards Green Growth. Paris: Organisation for Economic Co-operation and Development.
15.OECD. 2012a. OECD Work on Green Growth. Retrieved from: http://www.oecd.org/greengrowth/oecdworkongreengrowth.htm
16.OECD. 2012b. Green Growth and Developing Countries – A Summary for Policy Makers. Paris: OECD.
17.Qu, Y, Long, H. 2018. The economic and environmental effects of land use transitions under rapid urbanization and the implications for land use management, Habitat International, 82, 113-121, https://doi.org/10.1016/j.habitatint.2018.10.009.
18.Yale Center for Environmental Law & Policy and The Center for International Earth Science Information Network (CIESIN) at Columbia University’s Earth Institute. 2006 Pilot 2006 Environmental Performance Index. New Haven: Yale Center for Environmental Law & Policy and The Center for International Earth Science Information Network (CIESIN) at Columbia University’s Earth Institute. Retrieved from:
http://ciesin.columbia.edu/repository/epi/data/2006EPI_Report_Full.pdf
19.Yale Center for Environmental Law & Policy and The Center for International Earth Science Information Network (CIESIN) at Columbia University’s Earth Institute. 2018. EPI Report 2018. Retrieved from: https://epi.envirocenter.yale.edu/downloads/epi2018reportv06191901.pd f
20.Solow, R.M. 1956. A Contribution to the Theory of Economic Growth. Quarterly Journal of Economics 70, (1): 65-94.
21.Vaninsky, A. 2019. Environmental protection via optimal global economic restructuring, MethodsX, 6, 750-755
22.World Bank. 2012a. Inclusive Green Growth: The Pathway to Sustainable Development. Washington: World Bank.
23.World Bank. 2012b. Inclusive Green Growth - The Pathway to Sustainable Development, Main report. Washington: 12. World Bank. Retrieved from: http://documents.worldbank.org/curated/en/368361468313515918/Main-report
Published in
Vol. 6 No. 1 (2020)
Keywords
🛡️ Licence and usage rights
This work is published under the Creative Commons Attribution 4.0 International (CC BY 4.0).
Authors retain copyright over their work.
Use, distribution, and adaptation of the work, including commercial use, is permitted with clear attribution to the original author and source.
Interested in Similar Research?
Browse All Articles and Journals